Why Your BI Tool and Your AI Agent Disagree About Revenue
This is the first post in a three-part series. Part one covers the concept. Part two is a hands-on test of Apache Ossie against Snowflake and Databricks. Part three is what’s still missing, and one problem I’m not convinced is fixable.
The problem
Three people, one question: what was revenue last month?
- A notebook:
SUM(amount) - A dashboard:
SUM(amount) WHERE cancelled = false - A dbt model:
SUM(net_amount) * 1.2
Three different numbers. Nobody is lying. The definition of “revenue” is not written down anywhere shared, so each person encoded their own version of it once, in their own tool, and the three versions drifted apart on their own.
This isn’t a new problem. It’s one of the oldest problems in BI.
What a semantic layer is
A semantic layer sits between raw tables and whoever is querying them. It translates business language, things like “revenue” or “active customer”, into the query the underlying engine actually needs to compute them, SQL in most cases, though not always; DAX does the same job for Power BI.
The distinction that matters here is between the semantic layer and the semantic model inside it. The semantic model is the concrete set of definitions: metrics, dimensions, relationships, and business logic. The semantic layer is the system that exposes and evaluates those definitions for dashboards, analysts, or AI agents.
If you work with Power BI, you already have both. Power BI implements its semantic layer through a semantic model containing relationships, dimensions, and DAX measures. Every major platform has built its own semantic-layer implementation: Databricks has Metric Views, Snowflake has Semantic Views, and dbt has MetricFlow. None of them talk to each other. Define a metric in one and you’re redefining it from scratch in the next.
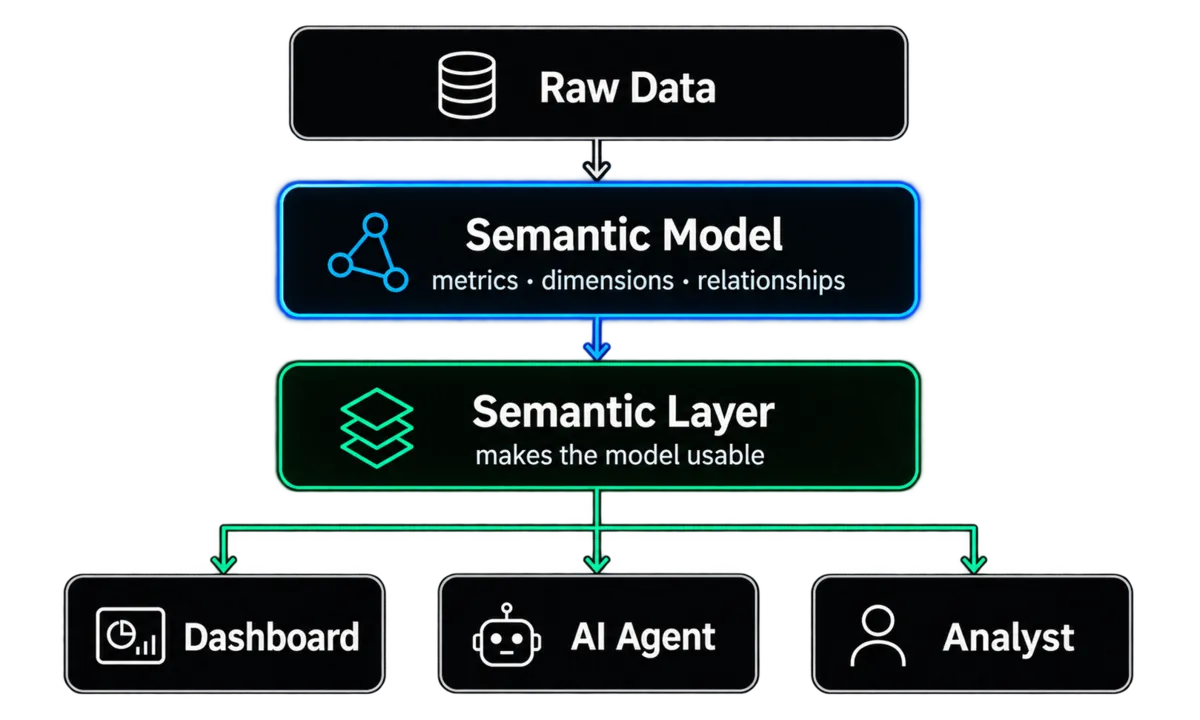
There’s a related, bigger term for this: ontology. Where a semantic model defines metrics, dimensions, and relationships for analysis, an ontology models the actual business objects, a Customer, an Order, a Flight, their properties and relationships, at a conceptual layer above any specific physical table. It’s the conceptual map of what exists in the business; a semantic layer uses those definitions to answer analytical questions. More on this later, once Ossie itself is on the table.
Why this got more urgent
Semantic layers aren’t new. What changed is who’s consuming them.
A human analyst who gets a metric definition brings context that document never carried. They know finance doesn’t trust a particular column, they remember the migration that left three columns holding the same value, they notice when a number looks off. An AI agent doesn’t have any of that. It gets the definition, picks a query path, and answers, fluently and confidently, whether the number is right or not.
A well maintained semantic layer is the difference between an agent giving a governed answer and a confident guess. That’s a big part of why platforms across the industry have converged on building the same kind of layer, some very recently, some over the past several years.
The landscape, right now
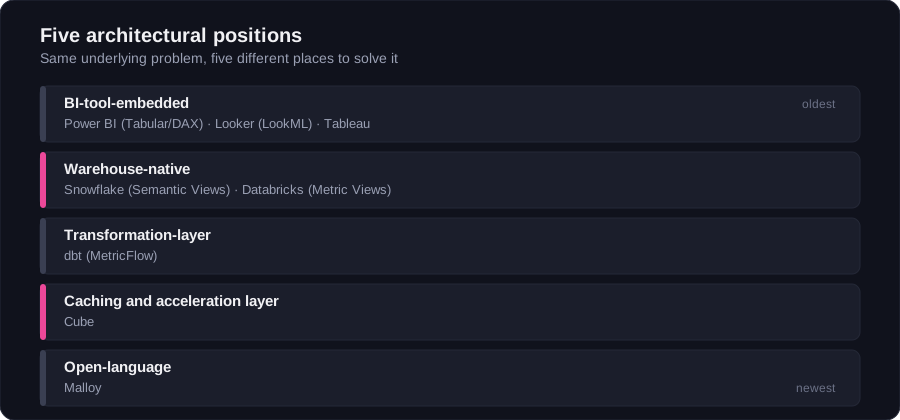
Every serious answer to this problem picks one of a few architectural positions. Worth walking through them properly, because the position a tool takes explains a lot about how it behaves later, and it’s the reason a single interchange format is harder to build than it sounds.
BI-tool-embedded. This is the oldest and most established position, and it’s the one most readers already know without realizing it has a name. Power BI’s Tabular model and DAX are exactly this: a semantic layer that lives inside the BI tool itself, with relationships and measures defined once and reused across every report built on that model. Looker’s LookML and Tableau’s data source layer take the same basic shape. The strength is tight integration, the modeling layer and the visualization layer were built for each other. The limitation is the one that motivated everything else on this list: tools like Tabular Editor or DAX Studio can connect to a Power BI model via its XMLA endpoint and read or even edit it live, so it’s not that nothing external can touch the definitions. What doesn’t travel is the format itself. Take that same model to Looker or dbt MetricFlow and there’s no export, only a rebuild.
Warehouse-native. Snowflake and Databricks both bet, within the last two years, that the semantic layer should live inside the database rather than as separate middleware. Snowflake’s version is the Semantic View, a schema-level object you define with CREATE SEMANTIC VIEW, listing TABLES, RELATIONSHIPS, FACTS, DIMENSIONS, and METRICS. Facts are row-level helper values, metrics are the aggregates built from them, and Snowflake lets you mark a metric as non-additive across specific dimensions, so it won’t silently sum something that should never be summed, headcount at a point in time, say. Standard SQL querying against semantic views reached general availability in March 2026. Cortex Analyst, Snowflake’s natural-language-to-SQL feature, is built on the same underlying idea, a defined semantic model grounding what the model is allowed to generate. In a 2024 internal benchmark against real-world BI questions, Snowflake reported over 90 percent accuracy with a semantic model in place, versus 51 percent for GPT-4o answering the same questions without one, worth reading as a vendor-reported number from a self-designed benchmark, not an independent audit, and from before the newer CREATE SEMANTIC VIEW object existed.
Databricks took the same architectural bet with Metric Views, registered as objects in Unity Catalog. The interesting piece is the MEASURE() function. Ordinarily, joining two tables with a one-to-many relationship and then summing a value from the “one” side can silently double-count it, each row on the “many” side pulls in a duplicate of the same value, and the sum comes out too high without any error or warning. That’s called fan-out, and it’s one of the most common, hardest-to-notice bugs in SQL and BI. Instead of writing SUM(amount) and hoping the joins around it don’t fan out, you call MEASURE(total_revenue) and the engine resolves the aggregation correctly using the relationship cardinality declared in the view. It’s the same principle your Power BI relationships and DAX measures already give you, just living in the warehouse instead of in a BI tool.
Transformation-layer. dbt’s answer, MetricFlow, sits one level up, in the transformation code rather than the warehouse itself. You define semantic models and metrics in YAML on top of your existing dbt models, and MetricFlow compiles that into SQL at query time, only joining in the tables a given query actually needs. It supports four metric types, simple, ratio, cumulative, and derived, and handles semi-additive metrics by letting you name a dimension, usually time, that a metric shouldn’t be summed across. MetricFlow was open-sourced under Apache 2.0 in late 2025. The trade-off is the one you’d expect from a Git-managed, PR-reviewed system: it’s excellent for stable, certified metrics, and slower for the ad hoc definition an analyst needs this afternoon.
Caching and acceleration layer. Cube takes a third position: an API-first, standalone service that sits between the warehouse and every consumer. You model metrics, dimensions, and joins once, and Cube serves them over SQL, REST, GraphQL, an MCP server for AI agents, and even DAX and MDX for spreadsheet tools. Its real differentiator is the caching architecture underneath, a two-level system combining an in-memory cache with Cube Store, a Rust-based OLAP engine that materializes pre-aggregations ahead of time. For high-concurrency dashboards this is the difference between sub-second responses and a warehouse bill nobody wants to look at. Cube Core is open source, Apache 2.0 on the backend, MIT on the client libraries.
The open-language approach. Malloy, originally from Google and now under an independent foundation, takes a different shape entirely: not a product, a language. You define sources, joins, and measures once, and Malloy compiles that down to SQL for whichever backend you’re pointed at, Postgres, Snowflake, BigQuery, DuckDB, Databricks, and others. Its most concrete technical contribution is symmetric aggregates, a way of automatically detecting join fan-out and correcting the aggregation for it, so a SUM() doesn’t quietly inflate just because you joined in a table with a one-to-many relationship. It’s the same fan-out problem Snowflake and Databricks solve inside their own engines, solved instead at the language level, portable across whichever engine you’re compiling to. It has no native support for SQL Server, Synapse, or Fabric, which matters if that’s your stack.
Five different architectural answers to the same underlying constraint: raw joins and aggregations don’t compose safely on their own, so something has to own the correct way to compute a metric, once. And every one of them is its own silo. A metric defined in Power BI doesn’t travel to dbt MetricFlow. A metric defined in dbt MetricFlow means nothing to Snowflake’s Semantic Views. A Cube data model doesn’t travel to Databricks. This is exactly the fragmentation Ossie is trying to sit underneath, not replace.
These five are the ones I know well enough to describe properly, not the full list. AtScale, Honeydew, GoodData, and ThoughtSpot all occupy some version of the same territory, and the roster keeps growing. The point isn’t that there are exactly five approaches, it’s that there are enough of them, built by enough independent teams, that nobody is going to consolidate this by picking a winner.
Why a shared standard makes sense
Point-to-point integration doesn’t scale here. With N vendors and no shared format, you need a converter for every pair to get full interoperability. With a neutral hub in the middle, each vendor writes one importer and one exporter, and interoperability with every other vendor comes for free.
That’s the same reasoning behind Protobuf, or Arrow as an in-memory columnar interchange, or LLVM’s intermediate representation for compilers. One neutral format in the middle, many things plugged into it, instead of a converter for every pair.
When you’d actually use this
Ossie isn’t a runtime dependency. It doesn’t sit in your query path, and it doesn’t replace your warehouse or your BI tool. Think of it more like a Protobuf .proto file, Google’s format for defining a data structure once and generating it in whatever language you need: a build-time artifact that compiles into whatever platform-specific format you actually need. A few concrete situations where that’s useful.
Migrating platforms. Two hundred metrics live in one tool’s semantic layer, and the org is adopting a new query engine. Without a neutral format, someone manually recreates every definition by hand. With Ossie, you export from the source into neutral YAML, then convert into the target. Two commands instead of transcription.
Running multiple tools at once. A warehouse, a BI tool, and an AI agent all need to agree on what revenue means. Instead of defining it separately in each, you define it once and convert it into each tool’s native format. Change it once, everything downstream follows.
Grounding an AI agent. An agent answering business questions needs a semantic model to ground its answers in. Those definitions usually already exist somewhere, in a BI tool, in dbt, in someone’s spreadsheet. Ossie lets you extract and convert them instead of rebuilding from nothing.
Wanting metric changes reviewed like code. If a team wants every metric definition versioned, reviewed in pull requests, and diffable the way code is, Ossie gives them a single file to be that source of truth, one place all the changes go through, instead of scattering them across whatever tool each person happens to be using. The converters become the deployment step.
What Apache Ossie is

Apache Ossie, formerly Open Semantic Interchange, entered the Apache Incubator on July 10, 2026. More than 50 organizations are behind it, including direct competitors like Snowflake, Databricks, Salesforce, and dbt Labs, alongside BI vendors, catalog vendors, and a handful of AI-focused startups. The project’s own framing on its homepage is blunt about the goal: “write once, query anywhere,” stop redefining revenue in every dashboard.
The core spec is small on purpose: datasets, fields, relationships, and metrics, in YAML or JSON, plus two escape hatches (ai_context for LLM-facing hints, custom_extensions for vendor-specific metadata that doesn’t need to mean anything outside that vendor). A trimmed excerpt from the project’s own TPC-DS example, real syntax, not marketing pseudocode:
version: "0.2.0.dev0"

semantic_model:
  - name: tpcds_retail_model
    description: TPC-DS retail semantic model for sales and customer analytics

    datasets:
      - name: store_sales
        source: tpcds.public.store_sales
        primary_key: [ss_item_sk, ss_ticket_number]
        fields:
          - name: ss_ext_sales_price
            expression:
              dialects:
                - dialect: ANSI_SQL
                  expression: ss_ext_sales_price
            description: Extended sales price (quantity * price)
            datatype: Decimal

    metrics:
      - name: total_sales
        expression:
          dialects:
            - dialect: ANSI_SQL
              expression: SUM(store_sales.ss_ext_sales_price)
        description: Total sales revenue across all transactions
        datatype: Decimal
Nothing exotic in that. That’s deliberate. The core spec is 653 lines, and its smallness is exactly why so many competing organizations could agree to sign onto it. A bigger spec would have asked every vendor to give up more. The full TPC-DS example this excerpt comes from runs to 631 lines, worth a look for the complete picture, multiple datasets, relationships between them, five metrics, and vendor-specific extensions for Salesforce and dbt carried alongside the core definitions.
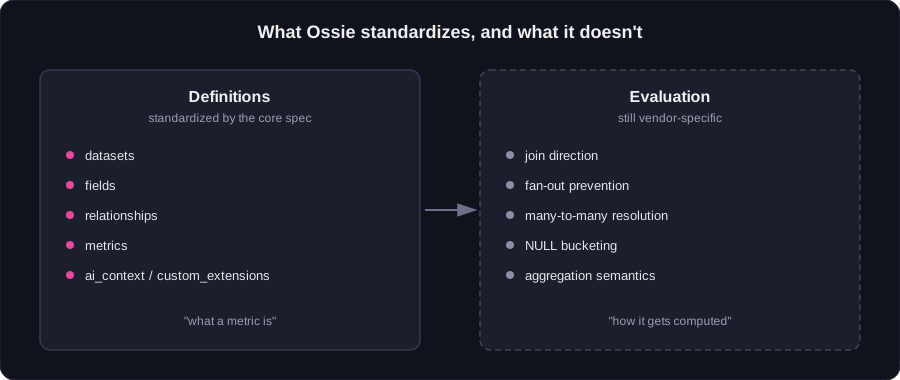
One distinction matters more than it might sound like it should: Ossie standardizes definitions, not evaluation. It says what a metric is. It doesn’t yet say how that metric gets computed once joins and aggregations get complicated. That gap is where a real, currently unresolved problem lives, and I’ll get into it in part three.
And the ontology idea from earlier: Ossie already has a separate directory for it in the repo, its own spec document, schema, and a worked example modeling flights and airlines. It’s real, just newer and less tooled than the core metrics spec, no dedicated validator or language bindings of its own yet, so I’m still setting it aside for this series rather than trying to cover both at once.
The timeline moved fast for something with this many stakeholders. Snowflake launched the initiative in September 2025 alongside Salesforce and dbt Labs. The repository opened in November 2025, the first spec version shipped in January 2026, and by June the project had enough momentum, over a hundred commits, dozens of merged pull requests, contributors from a dozen-plus companies, to bring a formal proposal to the Apache Incubator. It passed, and Ossie became a podling under mentors drawn from the Iceberg, Polaris, and Spark communities.
Worth naming honestly: the roster of more than 50 backers is a partner list, not a commit log. The project reports around 100 commits and 35 merged pull requests from 39 contributors since the repo opened, real activity, but a small enough headcount that a handful of companies are doing most of the actual work right now. That’s normal for a project this young, and it’s exactly the kind of thing ASF incubation exists to pressure-test before a project graduates. Worth keeping in mind as a nine-month-old bet still proving itself, not a settled, universally adopted standard yet.
That’s the pitch. On paper it’s a clean idea backed by an unusually broad coalition. I decided to actually test it, took the same semantic model, unmodified, ran it through the Snowflake and Databricks converters, deployed both for real, and queried them live.
Next post: what actually happened.